
Back in 2017, I attended the Ann Arbor, MI Google Earth Engine (GEE) workshop led by none other than Co-founder Noel Gorelick himself. Needless to say I was blown away.
Two years later, I found myself presenting my own materials at the Ameriflux 2019 Annual Meeting with the Early Career Network.
In this blog post, I’ll demonstrate how you can apply GEE and get started building your first site description. Ameriflux + GEE can get you some serious global coverage in applying your data.
If neither of these networks are familiar, know this: they’re making continuous data publicly available and easy to use.
Alright, let’s get started!
Skim the Ameriflux GEE Workshop presentation below, or jump right into the code: Repository to AmerifluxYSN_GEEworkshop2019
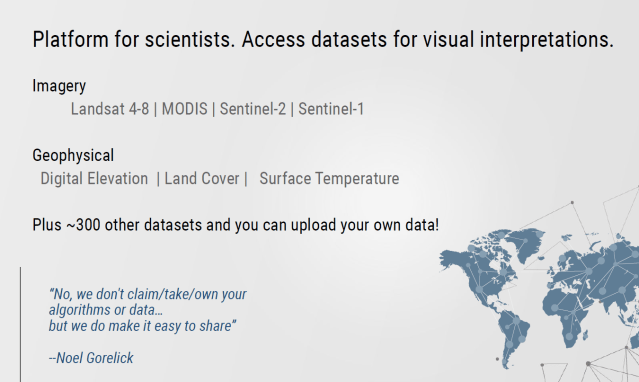
Google Earth Engine and why you should use it, as a scientist, stakeholder or curious person.
Not only can you select your data products in seconds, but you can filter and modify with easily accessible code. Online support is everywhere and GEE Developers have created tutorials to teach you the building blocks as well as the advance applications.
What are the applications you ask? It’s an petabyte-scale archive of publicly available remotely sensed imagery and other data.
First applications for Google Earth Engine were presented at the UNFCCC COP 16 conference back in 2010. Global Forest Watch, a dynamic online forest monitoring system, later launched in 2014 with thousands of stakeholders measuring and visualizing changes in the world’s forests to find deforestation. See more examples of GEE in action here: https://earthengine.google.com/case_studies/
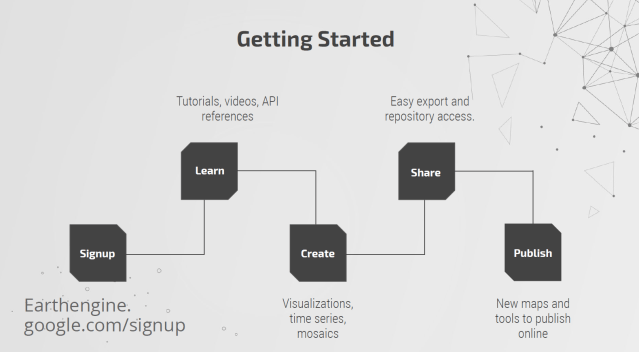
How to get started
Getting started is a two-step process.
STEP 1) Follow GEE’s online instructions here to create your account.
You’ll need access to GEE by making an account. Gmail address is preferred, but I’ve gotten access using my institution’s account as well.
The account will be necessary to use my workshop code and accept shared projects.
Once you apply, it can take some time to be granted access. One blog says up to three days while personal communication has showed me ~24 hours.
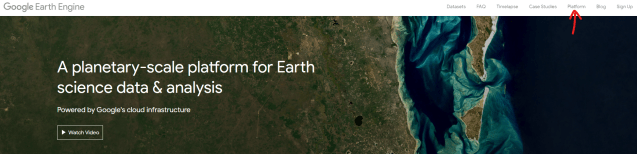
STEP 2) Open the code editor here: https://code.earthengine.google.com/
Getting to the API can be a bit tricky. If you open GEE’s home page, go to ‘platform’ and select ‘code editor’ in the upper navigation bar.
Once there, you’ll see something like this
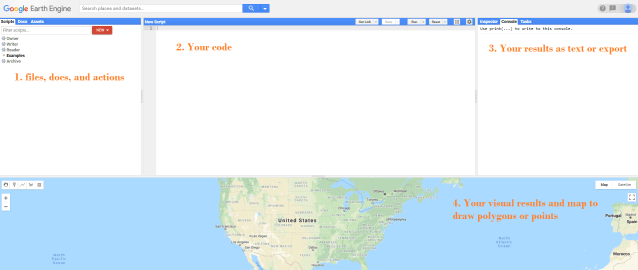
- Left panel: Includes where you can save GEE files by authorship, review GEE documentation and syntax, as well as upload your own data under assets.
- Middle panel: This is where you’ll use GEE’s special “camelCase” (i.e., adapted from javascript) code to create.
- Right panel: Results are printed on your console, exports need to be approved under tasks, and inspector is a tool that allows you to click on the map below and get a printed description of values.
- Bottom panel: You can visualize your results by adding it to the map below and create new regions of interest (geometries like polygons or points) to clip large data to where you’re analyzing.
Build your own site description workshop
I’ve prepared seven basic scripts to get you up and running quickly in GEE.

On the left, you’ll have scripts 1-3 teach you basics of GEE javascript. The code is adapted from GEE developer tutorials, so if you’re already familiar with coding here skip to…
…the right to explore existing data to get you one image, an image collection, raster data and land cover classification.
Each of the scripts 4-7 helps you create a point (using lat/long) and a study area of ~1000 meters surrounding it. The exercises have plenty of documentation for what you’re doing in each step.
What you’ll get out of this workshop
This code is unique in that it helps you organize multiple data sources to start your own site description. You’ll leave the tutorial with:
- A clean, cloud-free Landsat 8 scene over your study area
- Charts of Landsat 8 band means and NDVI over time
- Annual precipitation at your point of interest, as well as a chart over time
- A map of NLCD (USGS National Landcover Database) clipped to your study area
What this code doesn’t do is:
- Import your own data, such as a shapefiles. You can learn to do this on the Developer’s site with rasters and shapefiles.
- Break outside of the United States (sorry! it’s my home). You’ll need to explore the other datasets for that (e.g., CHIRPS precipitation) and conduct supervised classification Developer tutorial for land cover.
- Import geometries from drawing a region of interest in the map’s bottom panel. You’ll need to copy/paste your lat/long in there, or simply use the inspector tool to extract that.
Jump in and get coding!
https://code.earthengine.google.com/?accept_repo=users/shirkeyg/AmerifluxYSN_GEEworkshop2019
Click on the link above to accept my repository and explore the code. There are incomplete scripts as well as ‘answer’ scripts to help you work back to back and rebuild.
And with that, friends, you should be on your way.
Google Earth Engine all (?) the answers you need online. I’ve even heard that Noel Gorelick answers emails… but maybe try Googling it first!
Credits:
Gorelick, N., Hancher, M., Dixon, M., Ilyushchenko, S., Thau, D., & Moore, R. (2017). Google Earth Engine: Planetary-scale geospatial analysis for everyone. Remote Sensing of Environment.
